Back in May I wrote a blog about ‘xG added’, a metric that measures the value of passes. Basically it assigns a ‘danger’ value to the start and end location of a pass. The difference between both values is the ‘xG added’ by the player making the pass. If you want to read a more elaborate explanation, please check this blog. Lately I’ve been making some improvements to the model, of which I posted the first part last Friday: What is a possession-based model (and why does it matter)?
A big flaw in my previous version of the model, was that dribbles were not incorporated. This meant that if a player dribbled all the way across the pitch and then laid it off to his teammate when close to the goal, he would get almost no credit.
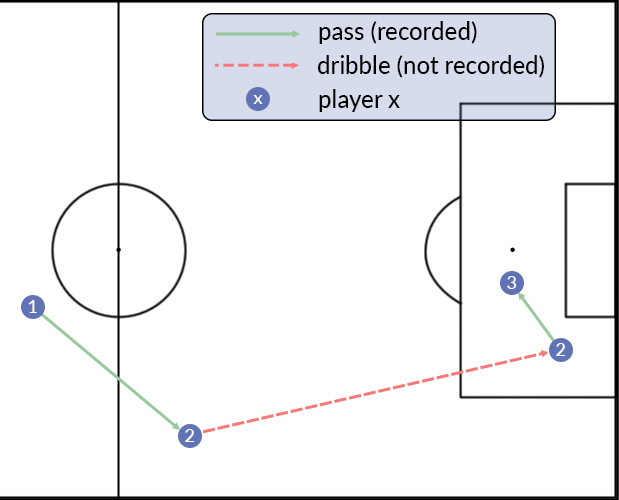
For instance, in the example above, player 2 would get no credits for the dribble but only for the pass to player 3 at the end. When you’re evaluating passes exclusively, that’s fine. However, the goal of xG added was to measure how good players are at progressing the ball, and dribbles are a big part of that.
I’ve been wanting to add this to my model for some time, and was re-motivated after reading this great article by Tom Worville (@Worville).
The problem with dribbles is, that they’re not recorded in Opta data. Only when another player is dribbled by, it is recorded as an event, whereas the dribble in the example above would not be recorded (assuming he doesn’t dribble past any players). However, as Michael Caley once said about this in a piece from about a year ago:
“[These dribbles can be] extrapolated from pass locations: When a player receives a pass in one location and then makes a pass from a new location, he can be assumed to have run on the ball from the first point to the second point.”
In other words, we can create these events ourselves. It might not be 100% accurate but it is a close estimation. Using the xG added model, we can now assign the start and end point of the dribble a ‘danger value’, using the possession-based model explained in my last blog. This gives every dribble an xG added value which we can use to assess player and team performance.
On a player level, we can look at the total xG added by dribbles over a certain period of time. For instance, let’s have a look at the best dribblers in the Premier League so far this season. The values are per 90 minutes, and only players with at least 500 minutes are included to make sure the sample size is big enough. This gives the following:
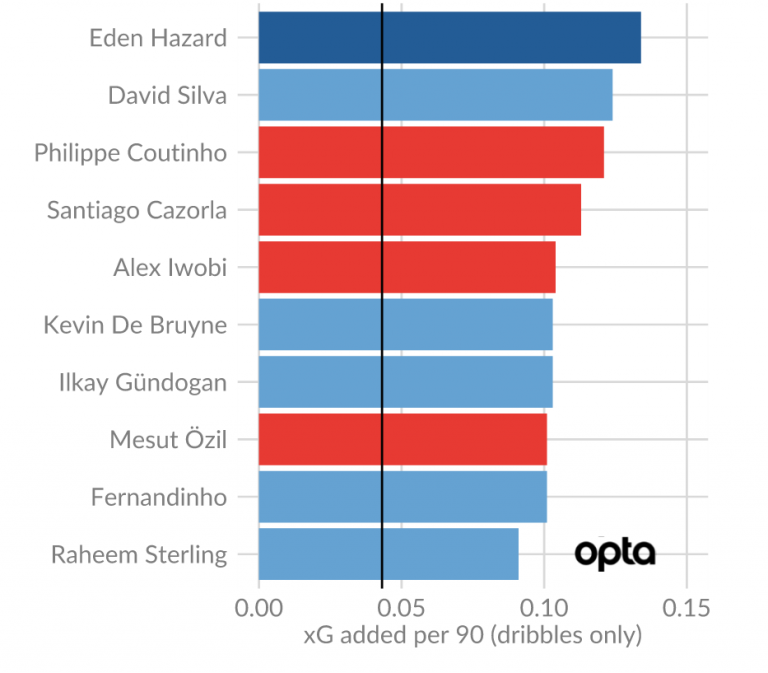
The black line in the middle shows the average xG added per 90 for all players with more than 500 minutes. The inclusion of dribblers like Hazard, Coutinho, Iwobi and Sterling in the top 10 are good signs.
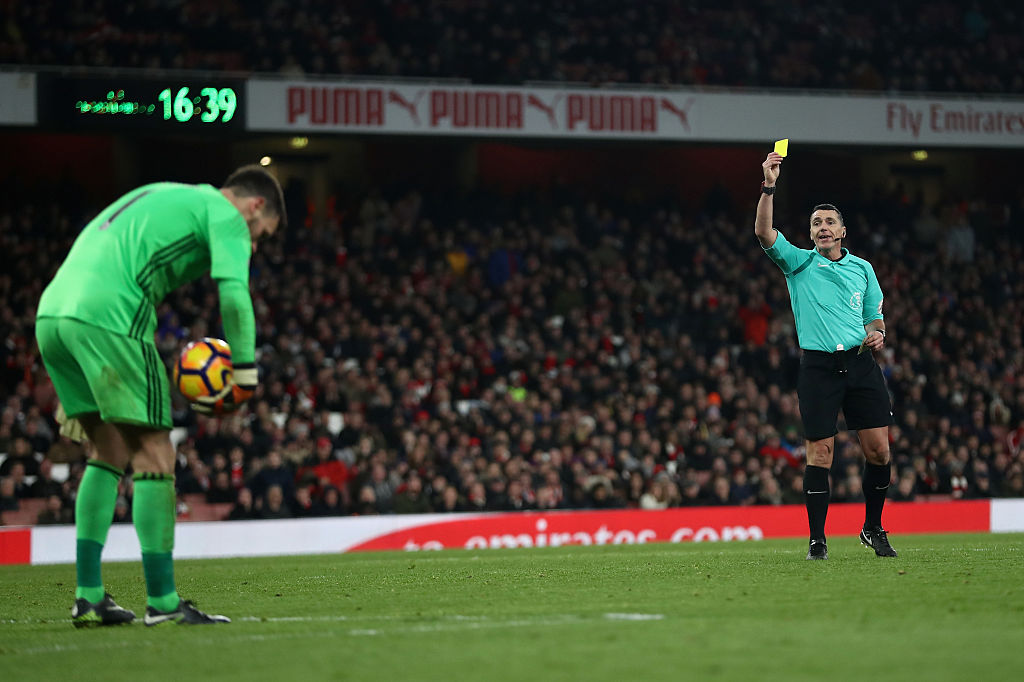
One thing to note, is that it’s very hard to stand out in this specific metric. Dribbles can only be so dangerous, as most of the time there will be defenders and/or goalkeepers in the way. For instance, dribbling into the danger zone (zone right in front of goal) is almost impossible, since the longer you will keep the ball, the more players you will attract towards you. Even the best dribbler in the world, Messi, often finds himself in these situations, and every time it happens we see a picture like this:

That’s the end of the road, even for a player like Messi. This makes it hard to gain a lot of xG added by dribbles only, but often dribbling the ball and attracting players gives you better passing options, as you will draw defenders out of position. That means that the effect of good dribbling is probably also indirectly measured in the xG added from passes and through balls. Even so, xG added by dribbles still seems to pick out the top dribblers in the league.
Another thing it seems to pick up, is defenders who tend to dribble into midfield. For instance, this is a plot of the 15 best dribbles by Koscielny:
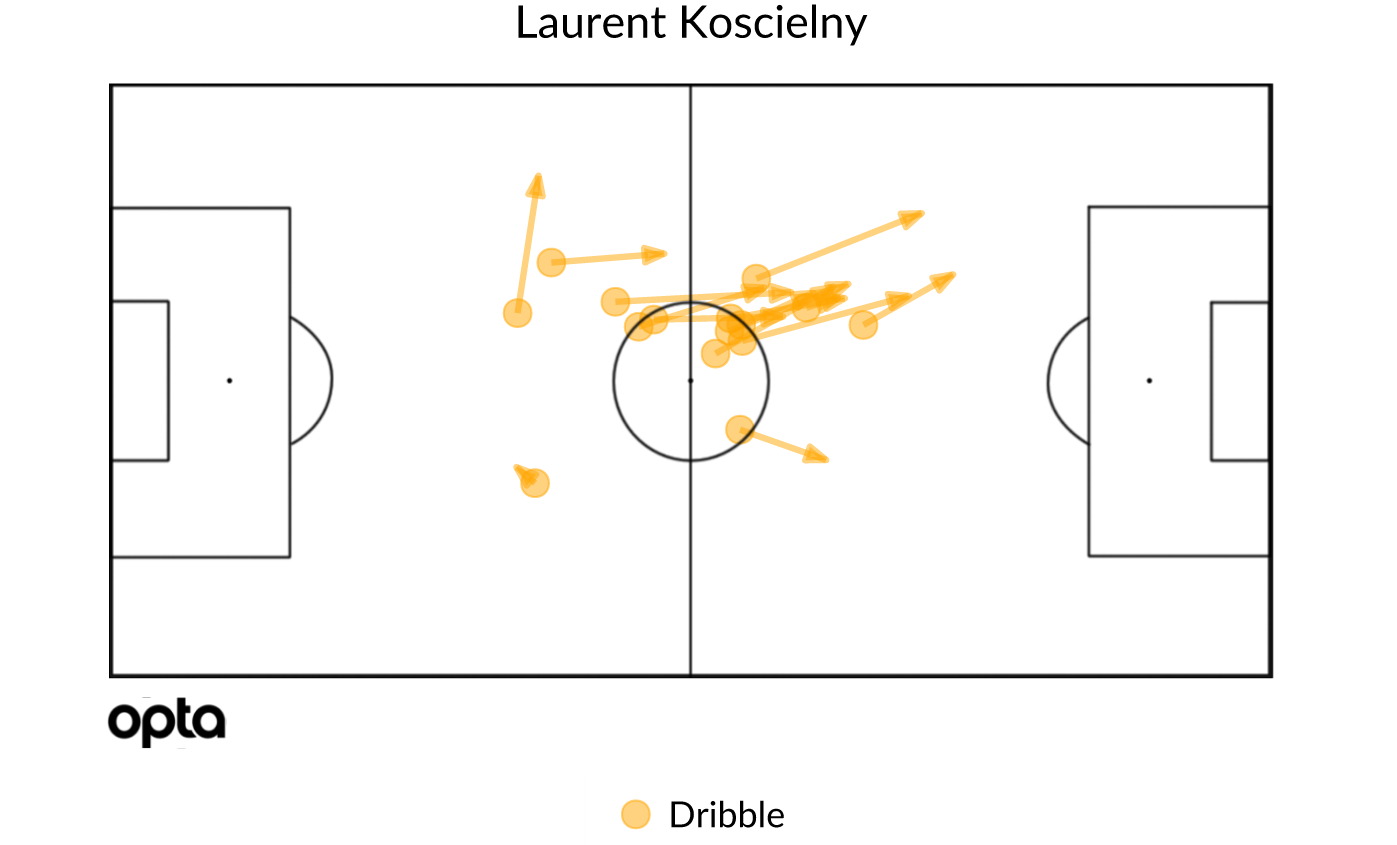
With an xG added by dribbles of 0.061 per 90 minutes, Koscielny is well above the average player. Defenders like Kolarov and Otamendi are even higher, but Koscielny is a nice example of a defender doing pretty well in this metric by dribbling into midfield. In contrast, somewhere at the bottom of the ranking we find Robert Huth (0.010 xG added by dribbles per 90), who seems to be afraid to keep the ball at his feet for longer than a few meters at a time:
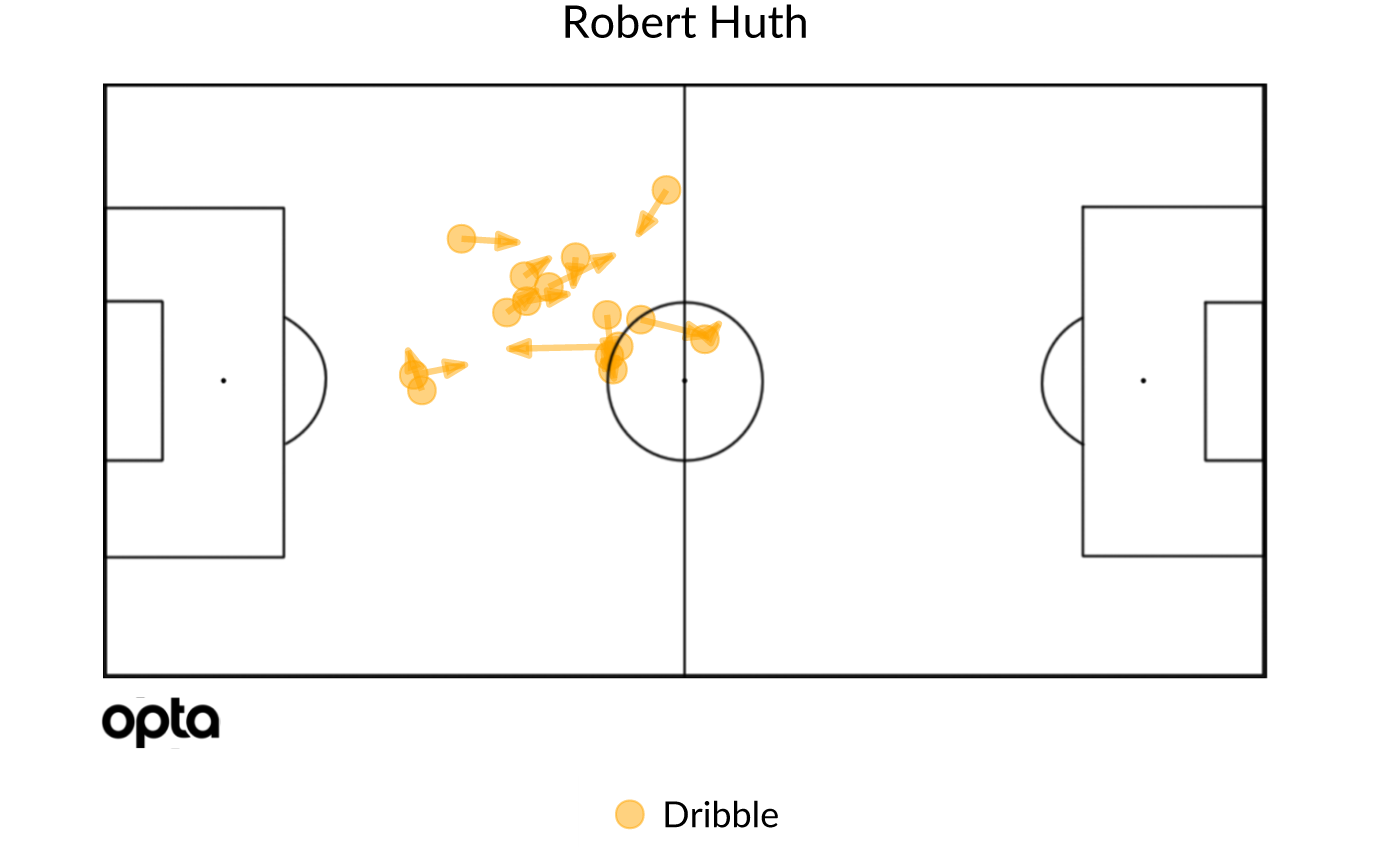
I guess you can say Huth knows what is strengths and weaknesses are pretty well. As you can see this metric offers a way to distinguish between these types of defenders, and reward players who progress the ball in this way.
The complete model
Let’s end with a quick look at the Premier League standings for players in xG added, so including passes etc.:
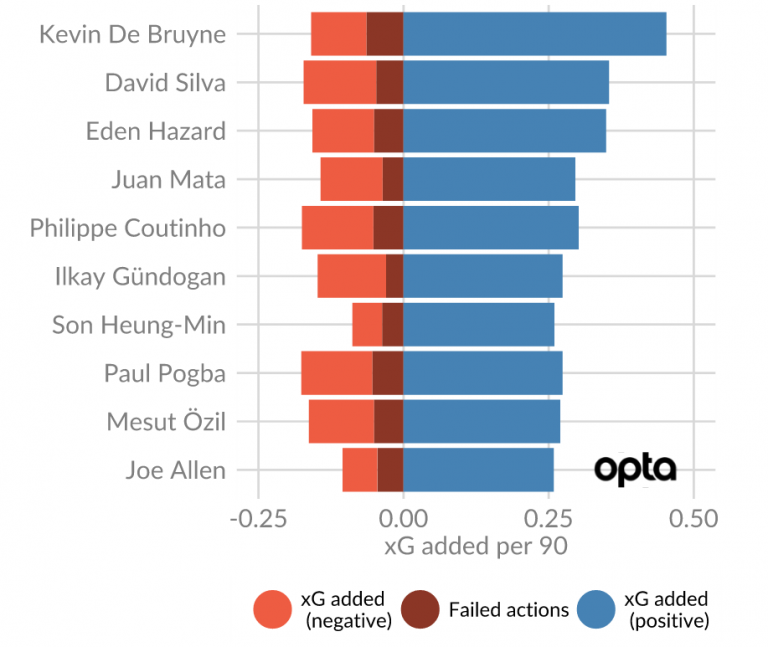
Belgium star De Bruyne leads the pack, which is no surprise. After Guardiola joined City he has really stepped up his game to new levels. Özil is a bit lower than last year, when he was at the top of the table. I’m sure as the season progresses, he’ll find his way back to the top. Other than perhaps Joe Allen, there are not many surprises here. Eden Hazard has gotten a nice bump due to his dribbling skill, just like Silva and Coutinho.
Let’s look at the xG added by teams:
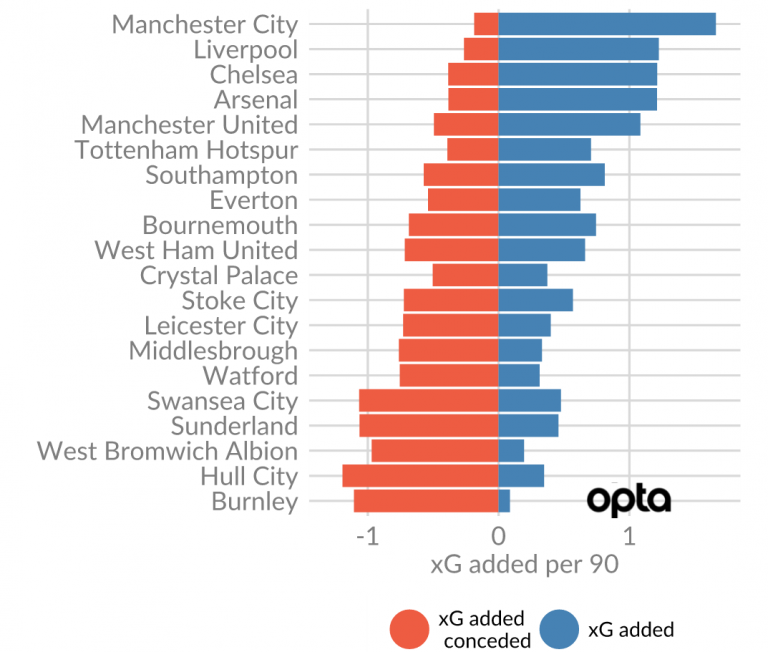
Manchester City is leading the pack, closely followed by the trio Liverpool, Chelsea and Arsenal. Manchester United is struggling to keep up with the top 4, both offensively and defensively. Tottenham’s offensive problems are clearly visible as well. Their defensive numbers are top class but they’re having some trouble with chance creation, with lower numbers than Southampton and Bournemouth. Even though they’re only 5 points behind Liverpool at the moment, I don’t see them challenging for the title if they can’t fix their chance creation problem.
Leicester City has been as unconvincing in the numbers as they have been in their results. At the bottom of the table we have a group of 5 teams with terrible defensive numbers. Where Swansea, Sunderland and Hull have at least some offensive output to counter that, WBA and especially Burnley have been dramatic offensively, according to xG added.
Thanks for reading! I hope you enjoyed it. If you want to know how your favorite Premier League player is doing in xG added, send me a tweet and I’ll send you his numbers. Feedback/comments are very welcome as always!