With Mesut Özil racking up a total of 18 assists so far this season, it’s clearer than ever that you don’t have to be a goal scorer to be a superstar. The record of 20 assists (Thierry Henry 02/03) might be out of reach with only 2 games to go, but there is no doubt Özil has been excellent for Arsenal this season. Last year the Premier League saw a similar story, in the form of Cesc Fàbregas. With 18 assists he also got close to taking the all-time record, and deservedly got a lot of praise for doing so. One year later however Fàbregas is no longer in the picture, with only 7 assists, putting him on a shared 13th place in the assists ranking. Surely he hasn’t suddenly lost the ability to be an elite playmaker right? Maybe the poor Chelsea season is causing his downfall? Or maybe, maybe assists as a measure of playmaker quality is just as superficial as goals is as a measure of a striker.
So I decided to dive into passing data from Opta to see if I could find a more sustainable metric that quantifies the skills Özil and Fabregas possess. My opinion is that every pass has a certain value, even if the pass doesn’t end up being a shot. Obviously defending midfielders or defenders can also be really good in build-up play, even though they rarely create shooting opportunities for their teammates and thus won’t show up in metrics like assists or key passes.
In general, a pass towards goal adds value to an attack, but is also harder to make. On the other hand, a pass away from goal often takes some danger out of the attack, and is usually easier to complete (obviously this isn’t always true since sometimes a player might be forced to play backwards in order to continue the attack). To try and quantify the value of a pass, I thus decided to assign xG (or Expected Goals, a metric that estimates the probability of a shot) values to the start location and end location of a pass. These values describe the probability a shot would become a goal if it would be taken from that location. In general a pass towards a more dangerous location is a good pass. For the start location I used a simple xG model that only uses location (more specifically distance to goal and angle to both posts) as input. For the end location I included the type of pass*, since a through ball is generally more dangerous than a cross. When you subtract the start xG value from the end xG value, you get the xG that was added by completing the pass. This value can also be negative, for instance if you pass backwards.
Obviously this is only relevant when the pass is actually completed, as when a pass is not completed a team loses possession. A good passer will try to minimize the amount of failed passes while still adding danger to an attack. For that reason for every failed pass a player is given a penalty of 0.01 xG. This number is fairly arbitrary and can be changed. Furthermore, the location where the ball is lost can also be of great importance. When the ball is lost close to the opponent’s corner flag one might argue that this is not a big deal. However when a player loses the ball close to his own goal, the team might have a serious problem. Therefore players are penalized for every failed pass in the form of the xG value for the opponent on the location where the failed pass ended. Obviously this has some overlap with the previous penalty but I think this is no more than fair, as a possession gained from an interception is usually more dangerous than an average possession.
Results
Summing all these values gives the following top 20 for the current season, in xG added per 90 mins. Only players who played more than 1000 minutes are included, which gives 277 players:
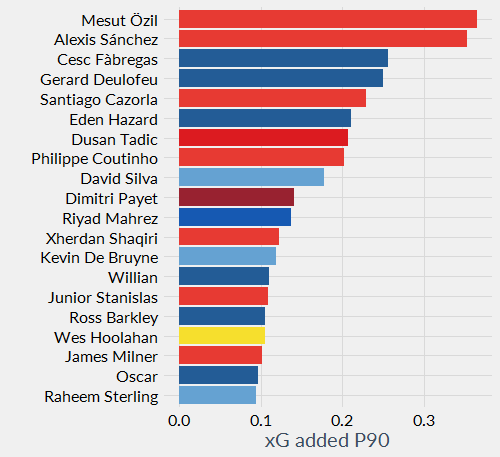
As we might have expected Mesut Özil is on top, although Alexis Sánchez closely following him might be somewhat of a surprise. Even more surprising we see Cesc Fàbregas in third, albeit quite far behind the first two. According to this metric his passing is still top class even though he hasn’t given as many assists as last year. Reasons for this could include bad luck, but also a position change. Maybe he started playing in a deeper position for Chelsea in comparison to last season. There obviously might also be other explanations for this, and if you have one I’d love to hear it. Whatever the reason this metric shows that his passing skill hasn’t dropped since last season.
The other names that complement the top 10 pass the eye-test quite comfortably, with an honorable mention for PFA Player of the Year Riyad Mahrez in eleventh. The fact that the first defender comes in at place 30 (Héctor Bellerín) and that the highest placed defenders are all full backs, indicates that it might not be useful to compare between different positions. Strikers also don’t perform well in this metric, although that seems logical to me since they often only receive the ball in advanced positions, after which their only options are likely to be as pass back or a shot. This doesn’t necessarily mean that strikers are bad at passing but it does mean that strikers generally don’t progress the ball to more dangerous areas with passes.
Repeatability
This looks nice but a metric only becomes useful when it is repeatable. To test this I calculated the values for the past 14/15 Premier League season, to see if there is a correlation between xG added in two consecutive seasons. In total 173 players played over 1000 minutes in both seasons. When comparing the xG added for those players over the two seasons I got the following results:
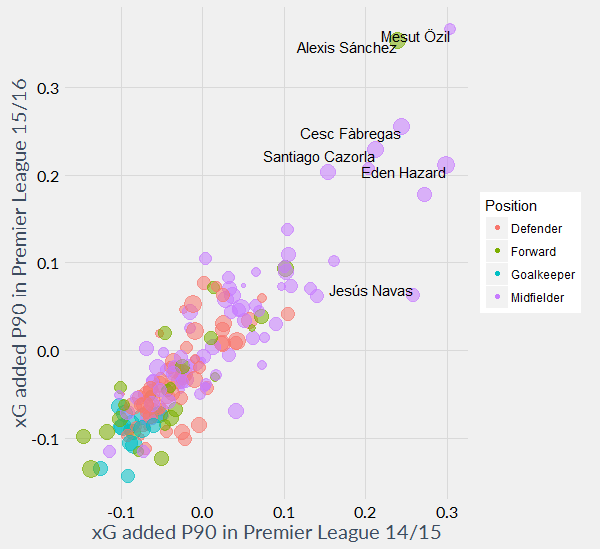
Colours indicate the position of a player and the size of the dot is bigger for players who played more minutes. This looks like a very strong relationship, with an R-squared of about 0.79. Part of what made this possible is sample size. Since passes occur a lot, especially in comparison to for instance assists, this metric has a lot more certainty than key passes/assists only.
When we only look at the 173 players who played over 1000 minutes in both seasons, it’s amazing to see that from the top 10 in 14/15, an amazing total of 8 players are still in the top 10 in the current season. Furthermore, Riyad Mahrez was already in 15th place last season, even though he was hardly seen as a world class player back then. Similarly, when we look at the current season, I notice some names that are fairly high up that I haven’t heard of too often. For instance, in 14th place this season is Junior Stanislas, a 26 year old winger for Bournemouth this season. He has only had 2 assists this season but my metric suggests he knows what he is doing. Perhaps we’ll see more of him next year. In that way this metric might be used by clubs as a way to scout new players, or to evaluate the passing skill of players they currently have. If a club would’ve known a year ago that Mahrez is a top class player, they could’ve probably gotten him for at least half of what he is worth now. Obviously this is only one player and we have no idea how this will play out in the future, but I’m excited to see how players high up the list this year will perform next year.
I’ll stop here because I don’t want this to become too long. There are many more interesting things to say about this, as we can also see which player adds the most xG through long balls, through balls, crosses etc. Looking at age groups might also give an insight into which players will become elite passers in the future. If you have any suggestions for further research or if you want to know how high a certain player is on the list, contact me on Twitter (@NilsMackay).
This is also the first version of this metric, so chances are there’s plenty of room for improvement. If you have any ideas of how to improve this let me know.
*The types of passes I used for this are normal passes, long balls, through balls and crosses. Set pieces and thrown-ins are removed from the data.